
American Students Continue to Fail
Five for Friday, January 31, 2025


The NAEP scores are out! The NAEP scores are out!
For those outside the world of education geekery, this doesn’t sound terribly exciting, does it? With planes crashing in the air and the Senate losing their minds in confirmation hearings, news about this national test around math and reading was a back-page topic this week.
But you should pay attention because the NAEP scores are important. Even more than the Blake Lively and Justin Baldoni feud. I’m serious!
It’s a Friday, so I’m going to do this fast. Here are five fun facts about the NAEP:
What is the NAEP?
The NAEP is a nationwide test that measures the educational levels of all students in the country. It is administered in all fifty states to a random sample of 10,000-20,000 students in grades 4, 8, and 12. The schools are chosen from a “sample of schools whose students reflect the varying demographics of a specific jurisdiction.” So, students are random, and the schools are not.
Why isn’t this test given to every student across the country at the same time? The short answer is that the national government doesn’t have the capacity or the authority to administer a full nationwide exam to all 54 million students. The states are responsible for education in this country, and they don’t want you to know how they compare to other states.
In his unfairly maligned No Child Left Behind initiative, Bush made the states establish better assessments of their students. Since then, state standardized tests were watered down by the education establishment, so the NAEP test is really the best method to take the pulse of American education.
Although the NAEP test is limited in scope, it’s still a good test. The sample size of 20,000 is respectable, and the test is considered fair and accurate.
Most American Kids Are Not Proficient
Okay, let’s talk about the big picture. How many kids are deemed to be proficient in their subjects?
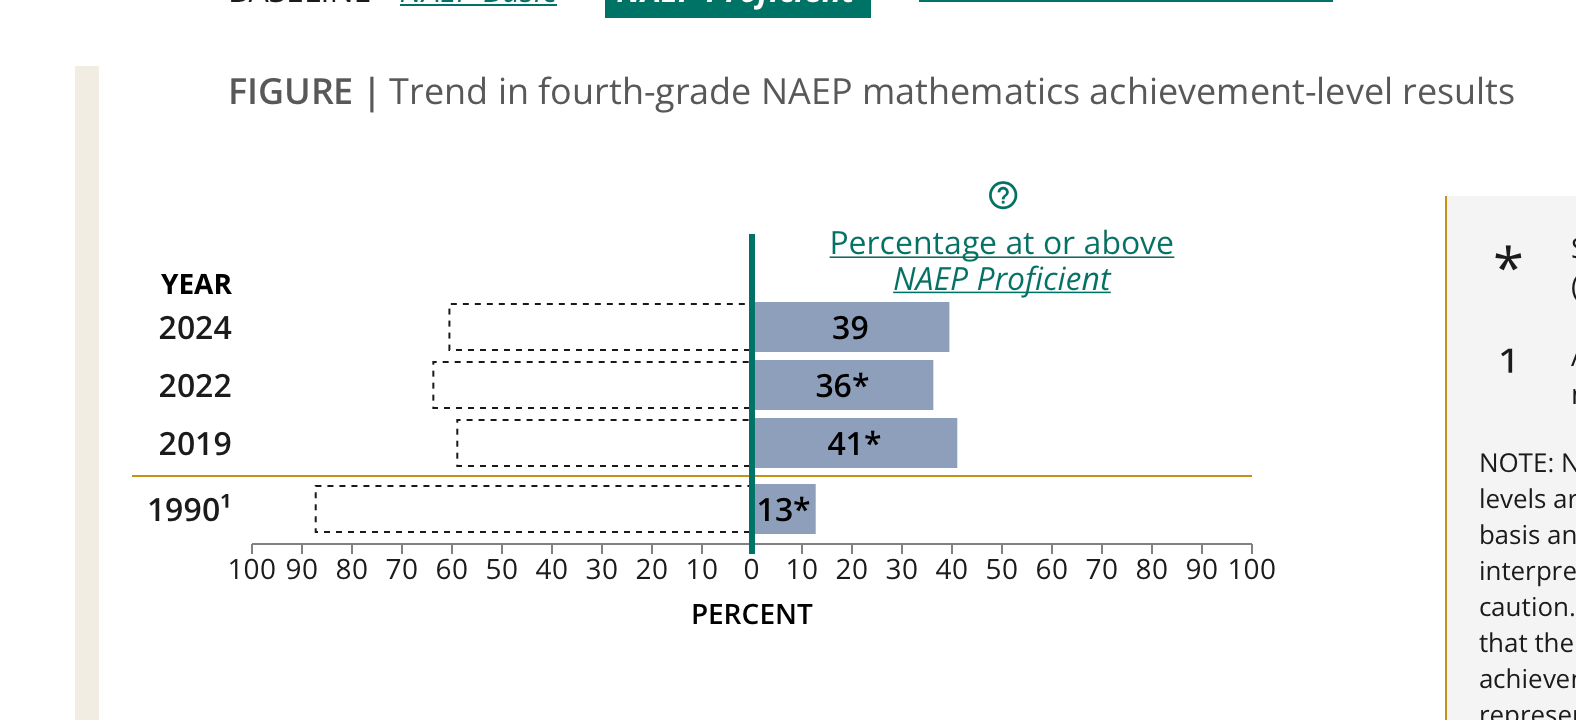
In 4th grade math, 39 percent are proficient. In 8th grade math, the proficiency number drops to 28 percent.
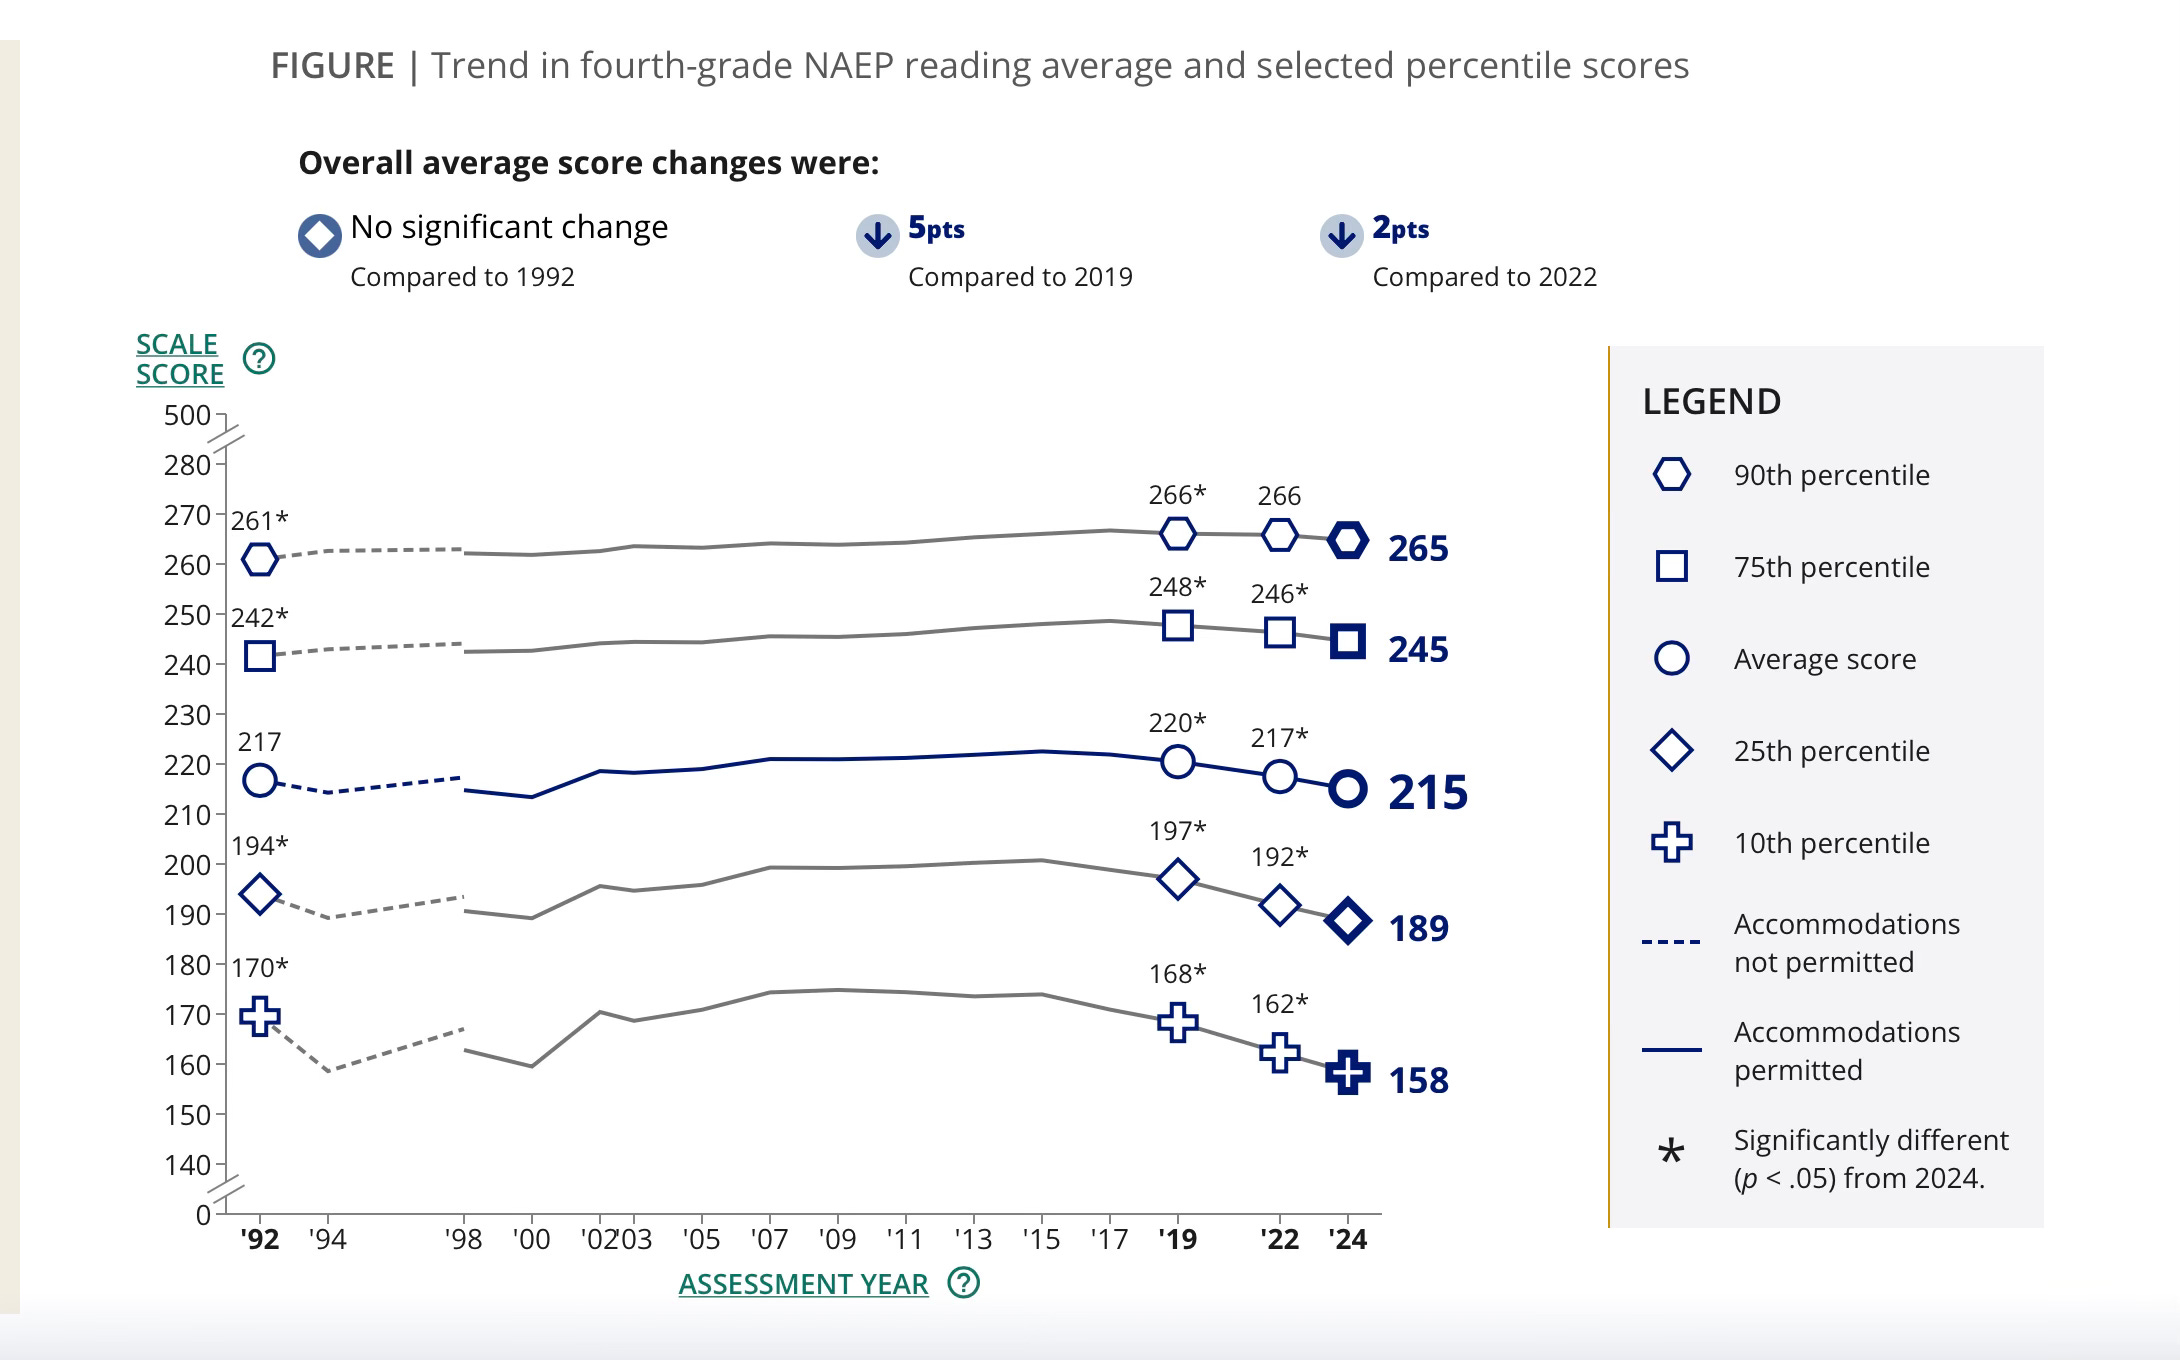
In reading, 31 percent of fourth graders were proficient — two points worse than in 2022, when the test was last administered. In 8th grade, 30 percent were proficient.

What does it mean when around 70 percent of American students are not proficient in reading and math? It means that most American students cannot comprehend a short passage of fiction enough to explain the motivations of the characters. They won’t understand the main idea or recall facts in a simple non-fiction passage. Fourth graders can’t identify basic shapes or solve a word problem that involves addition. Eighth graders can’t read a bar chart.
COVID Made Things Worse
Test scores — across states and demographics — dropped since 20202, when COVID caused school disruption. The biggest dips happened with the lowest-performing students. In 2019, the median reading score for the lowest quintile of students dropped by ten points.
The numbers continue to drop even though COVID is over and despite the billions spent to remediate learning loss from COVID. Nearly all levels of students scored worse on the NAEP compared to 2022, except for the highest performing students, and only on the math tests. What happened?

Once behind, the kids never recovered from the years when school didn’t happen. Yes, the federal government gave schools $190 BILLION to the schools to help kids catch up, but the money never got to the kids. In September of 2022, I ranted about the crappy COVID response. That essay still holds up.
Some Scored Worse Than Others
These numbers were bad for all types of students, but the most embarrassing, awful numbers are concentrated in certain groups. Our lowest-performing quintile of students struggled. By definition, the lowest-performing quintile will always have the worst scores, however, this report shows a continual dip in performance. We have set a new bar for the poor performance.
From Chalkbeat:
The share of fourth graders who scored at the very bottom of the NAEP scale was at its highest point in 20 years. The share of eighth graders scoring at the lowest level was the highest ever. In both grades, students who did not reach the NAEP Basic level — relatively low performers at the 25th percentile and under — had lower scores than in 1992, when the first NAEP test was given.
Who are these lowest-performing students? They’re probably special ed kids, though I haven’t seen data on that yet. They are also lower-income students in urban areas. Those groups had the hardest time recovering from the damage of school closures.
The New York Post ranted about the city’s NAEP scores and the $89 billion price tag for its schools.
And across the five boroughs, public schools spent an average of $21,112 per student in fiscal year 2023-24, though dozens of schools shelled out a large chunk more – up to $60,000 a student, records show.
Despite the sky-high spending, only 33% of Big Apple fourth graders scored proficient in math and just 28% were proficient in reading last year, according to the results.
Older students’ results were even worse – 23% of city eighth graders were found proficient in math and 29% in reading.
Across the country, the difference in scores between black and white students is shameful. For example, the average score for white students for fourth-grade reading was 225, compared to an average score of 199 for black students. Apparently, Wisconsin has the biggest gap between black and white students.
Some states did better than others. Only 23 percent of fourth-grade students in New Mexico are proficient in math, compared to 51 percent of students in Massachusetts. For eighth-grade reading, 19 percent of New Mexico students are proficient, compared to 40 percent in Massachusetts.
Maybe Massachusetts should put a slogan on their license plates: “40 percent of our kids can read! Go us!”
Some pundits claim that states that instituted better curriculum reforms saw the most improvements. Maybe.
A Problem That’s Going to Require a UBI
Looking at these scores, it’s hard to see a way out of this hole. In the next few years, American schools will graduate millions of students without an adequate education to make change at a taco shop or complete a job application.
Have you seen the TikTok videos by the guy who asks young people questions about math and geography? Worth a look. Sample questions: What state is Utah in? How many states are on the flag? What country did the Vietnam War happen?
Our students can’t work in a modern economy. The factory jobs are gone. AI is about to eliminate another level of employment. One-fifth of adults in our country will need a Universal Basic Income (UBI), so they don’t starve.
Related:
Want more? Play with the data here and here.
Upcoming: I’m going to be chatting with Andy Rotherham from Bellwether Associates (aka Eduwonk) on Thursday, February 6th, at 3:00ET on LinkedIn Live. Come check it out!
Personal: Pictures of the autistic kid in his new dorm room. He’s doing great.
Recovering From Learning Loss

Yesterday’s headlines screamed “Pandemic Erased Two Decades of Progress in Math and Reading.” According to results from the latest National Assessment of Educational Progress tests, also known as the NAEP, the reading and math scores of a randomized sample of 9-year olds dropped to levels from two decades ago. Students of color experienced the largest d…
I teach middle school and these scores just add numbers to patterns I've noticed since before the pandemic.
Now if I could just off road, teach some basic decoding and work other basic skills, I have no doubt scores from my little classroom square would rise. However the institution isn't exactly flexible to student needs.
Also, who listens to teachers? We've known this stuff at the ground level for years but have no voice. Everyone thinks we're off indoctrinating kids when, truth is, we can't get them to bring pencils to class or properly use folders.
Here's some encouraging data that adds another dimension to this story: Federal pandemic-relief funding specifically targeted at homeless students (ARP-HCY) has shown remarkable success.
Recent federal study (https://schoolhouseconnection.org/article/new-federal-study-shows-investment-improvements-for-homeless-students) found that schools receiving this funding saw reading proficiency rates 10 points above the national average for homeless students, while also decreasing chronic absenteeism by 5 percentage points. These improvements came while schools were actually identifying and serving 25% more homeless students than before.